
Time is the most crucial concept in any business domain. We need to plot down our sales progress number, revenue data, or maybe bottom line, growth, and even prepare forecasts for the upcoming days which are all based on the time constraints.
Yes, I can understand that this seems quite a complex topic to understand for beginners. But no worries, in this particular blog we will understand Time Series Analysis in the Business Sector and its importance for the development of our business analytics.
Now, what is Time Series? A time series is nothing but a series of data points listed or graphed in time order. On a deeper note, time series data points are the images of understanding the past events, or trends that basically indicate the significant business growth track happened in the past decades and where they are lacking, identifying the loopholes and need to overcome in the future.
In today’s cooperative world, the huge amount of growing big data, alongwith the need for real-time insights, time series analysis has become an essential part in every professional and business world. For example, measuring the value of retail sales each month of a particular year and then comparing each recorded data would comprise a time series.
The next question that arises in our mind is what are the main goals of time series analysis or why even analyze a time series? Because, it is the preparatory step before we develop to forecast some important data. Precisely, there are two main goals: one is identifying the nature of the phenomenon represented by the sequence of observations, and secondly, predicting or forecasting the future values of the time series variable. The main aim of both of these goals is to identify the pattern of observed time series data and describe it formally. Once the pattern is established, we can interpret and integrate it with other datasets.
An observed Time series can be decomposed into various components where each component expresses a particular aspect of the movement of the values of the time series. The four main components include foremostly the secular trend, which describes the movement along the term, next the seasonal variations, which represent seasonal changes, then the cyclical fluctuations, which correspond to periodical and finally, the irregular variations, which are other nonrandom sources of variations of series.
So, by now we have got a brief idea on what is time series, its analysis and importance too. Now, let’s understand why we actually need historical data which helps in decision-making:
- It helps to measure and keep track of KPI’s, and compare them across product locations and categories.
- It identifies events which especially affect the product demand in the market.
- It helps to easily understand the customers trend and direct the business accordingly from an early stage
Applications of time series analysis include mainly anomaly detection and comparative analysis. Lets try to understand them in a more detailed manner.
Anomaly detection: What is anomaly? In simple words, it is an occurrence of some unordinary or abnormality in any observation in our dataset like we can consider a sudden spike in credit card transactions of a customer on checking his daily transactions. In the same manner, if there are occurrences of sudden spikes and dips in time series plots of any data points, then those also qualify as outliers.
There are a few Python and R packages available which are dedicated to anomaly detection such as Python Outlier Detection Module in python, and ts outlier and Anomaly Detection in R programming language. Machine Learning algorithms which include classification and regression trees are one of the most robust and most effective techniques which can also be applied to anomaly detection problems in several ways.
Comparative analysis: A comparative analysis is that section of time series analysis which depicts similarities and differences between time-dependent observations. It can be used to compare the performance of multiple entities as well. Considering an example we can assume the plotting time series data of population growth in different countries which will reveal important information on how a particular country is headed compared to some other country.
The foremost understanding of past growth events through time series analysis doesn’t require any colourful data visualization or data modeling rather just plotting data against the time helps to generate powerful insights.
In earlier days, we normally used spreadsheets to create powerful visual stories and insights which were not bad. But, with the advancement of technology, most statistical and data analysis tools which include Python, Tableau, PowerBI can easily handle time-series data in order to create time series charts, dashboards etc in a pretty well manner.
Keeping the blog short, let’s understand time series visualization using Python Programming.
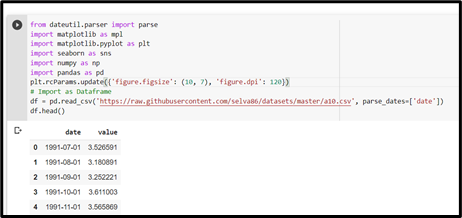
Step 1: The data for a time series is normally stored in .csv files and it contains two values namely the date and the measured value. Let’s use the dataset on Australian Drug Sales and check out accordingly.
We need to use the read_csv() in pandas package to read the time series dataset, and then adding the parse_dates=[‘date’] argument will make the date column to be parsed as a date field in our data visualization.
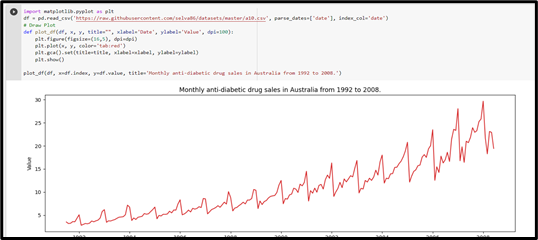
Step 2: Let’s use matplotlib to visualise the series by importing the matplotlib library. While writing the code for plotting, we need to initialize the title, x-label and y-label, figsize and other attributes for better understanding by the viewer.
The summarizing lines…
In concluding words, we can now say time series data provides a wealth of analytics and possibilities in all domains of applications, and so data scientists can make huge contributions to their domains taking advantage of these tools and techniques. I hope that’s enough for now. We started from the very basics of time series and have understood its various characteristics in the business domain. We have walked through the goals and basic components of time series analysis, applications in practical fields and understood in-depth the step by step process to plot time series using Python and its visualization.
Be the first to comment on "Time Series Analysis in Business Sector"